
Usage with Shiny

Using sketch code in Shiny#

Use compile_r to turn a sketch R file into a JavaScript file, copy it into the www folder of the shiny App, then include the script tag tags$script(src = ...) in the shiny UI.

A full example#

Here is an example of a Shiny App with and without sketch code.

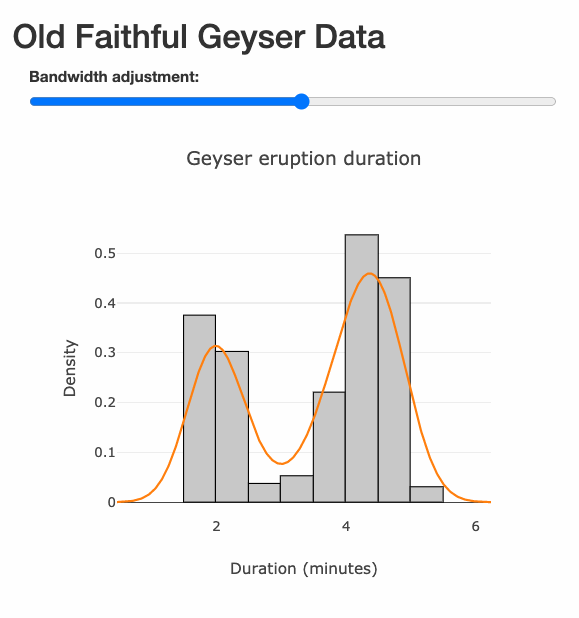
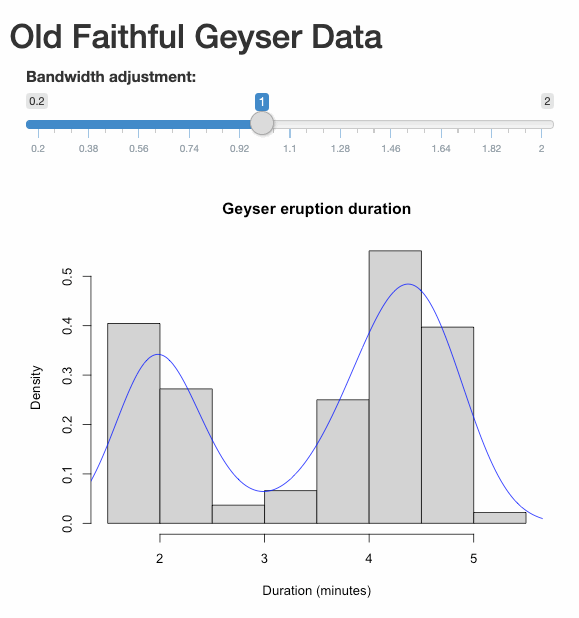
The advantage of using sketch is that it gives you complete control of the JavaScript behaviour, but the disadvantage is of course that more work is needed to achieve such control.

Source code#

app.R#

library(shiny)
# Define UI for application that draws a histogram
ui <- fluidPage(
tags$head(tags$script(src="https://cdn.plot.ly/plotly-latest.min.js")),
titlePanel("Old Faithful Geyser Data"),
mainPanel(
tags$script(src="dom.js"),
tags$script(src="slider.js"),
tags$script(src="plot.js"),
)
)
# Define server logic required to draw a histogram
server <- function(input, output, session) {
# Send data for plotting the histogram at the start
session$sendCustomMessage(
"hist_data",
list(x = faithful$eruptions, probability = TRUE,
xlab = "Duration (minutes)",
main = "Geyser eruption duration")
)
# When a slider value is received, send the density values over
observeEvent(input$slider_value, {
cat("\nMessage received\n")
print(input$slider_value)
bw_adjust <- as.numeric(input$slider_value$data)
dens <- density(faithful$eruptions, adjust = bw_adjust)
session$sendCustomMessage("den_data", dens)
})
}
# Run the application
shinyApp(ui = ui, server = server)

dom.js#

dom.js is provided by the sketch package, and the file path can be found using src("dom"). Suppose you are at the Shiny App directory, in which there is an www folder, then dom.js can be generated by running file.copy(src("dom"), output = "./www/dom.js").

slider.R#

# Create a bare bone slider
container <- dom("div", list(id = "slider_1"))
label <- dom("label", list(innerText = "Bandwidth adjustment:"))
slider <- dom("input", list(type = "range", min = 0.2, max = 2,
value = 1, step = 0.01, style = "width: 480px"))
# Send commands to R when the slider changes
slider$oninput <- function() {
# Use method provided by the Shiny object
Shiny$onInputChange("slider_value", list(bw_adjust = self$value))
}
print_dom(container, ".col-sm-8")
print_dom(label, "#slider_1")
print_dom(slider, "#slider_1")

Generate slider.js using the following command:

compile_r(
input = "slider.R", output = "./www/slider.js",
rules = basic_rules(), deparsers = basic_deparsers()
)

plot.R#

hist_container <- dom("div", list(id = "myDiv", style = "width: 500px"))
print_dom(hist_container, ".col-sm-8")
# Histogram plot
hist <- function(msg, at = "myDiv") {
declare (data, layout)
data <- list(x = msg$x, type = "histogram",
histnorm = ifelse(msg$probability, "probability density", "count"),
marker = list(color = "rgb(200, 200, 200)",
line = list(color = "rgb(0, 0, 0)", width = 1)))
layout <- list(title = msg$main,
xaxis = list(title = msg$xlab),
yaxis = list(title = ifelse(msg$probability, "Density", "Frequency")),
showlegend = FALSE)
Plotly::newPlot(at, Array(data), layout)
}
Shiny$addCustomMessageHandler("hist_data", hist)
# Density plot
trace_exists <- FALSE
density <- function(msg, at = "myDiv") {
declare (data)
data <- list(x = msg$x, y = msg$y, type = "scatter", showlegend = FALSE)
if (!trace_exists) { # Add trace if not existed
Plotly::addTraces(at, data)
trace_exists <- TRUE
} else { # Update trace if existed
Plotly::deleteTraces(at, -1)
Plotly::addTraces(at, data)
}
}
Shiny$addCustomMessageHandler("den_data", density)

Generate plot.js using the following command:

compile_r(
input = "plot.R", output = "./www/plot.js",
rules = basic_rules(), deparsers = basic_deparsers()
)